Publication-quality Stata output, without writing or debugging commands.
You type the request. Noolio writes the commands and runs them. Think Claude Code for econometrics.
Charts and tables, ready for the paper.
You describe the chart: "scatter plot of income vs. education, colored by region." Noolio runs the Stata graph command on your machine and opens the figure in a separate window.
Tables come out the way you need them for the paper. Coefficients, standard errors, significance stars, R-squared, formatted and ready to read. Export to .tex and drop it into your draft.
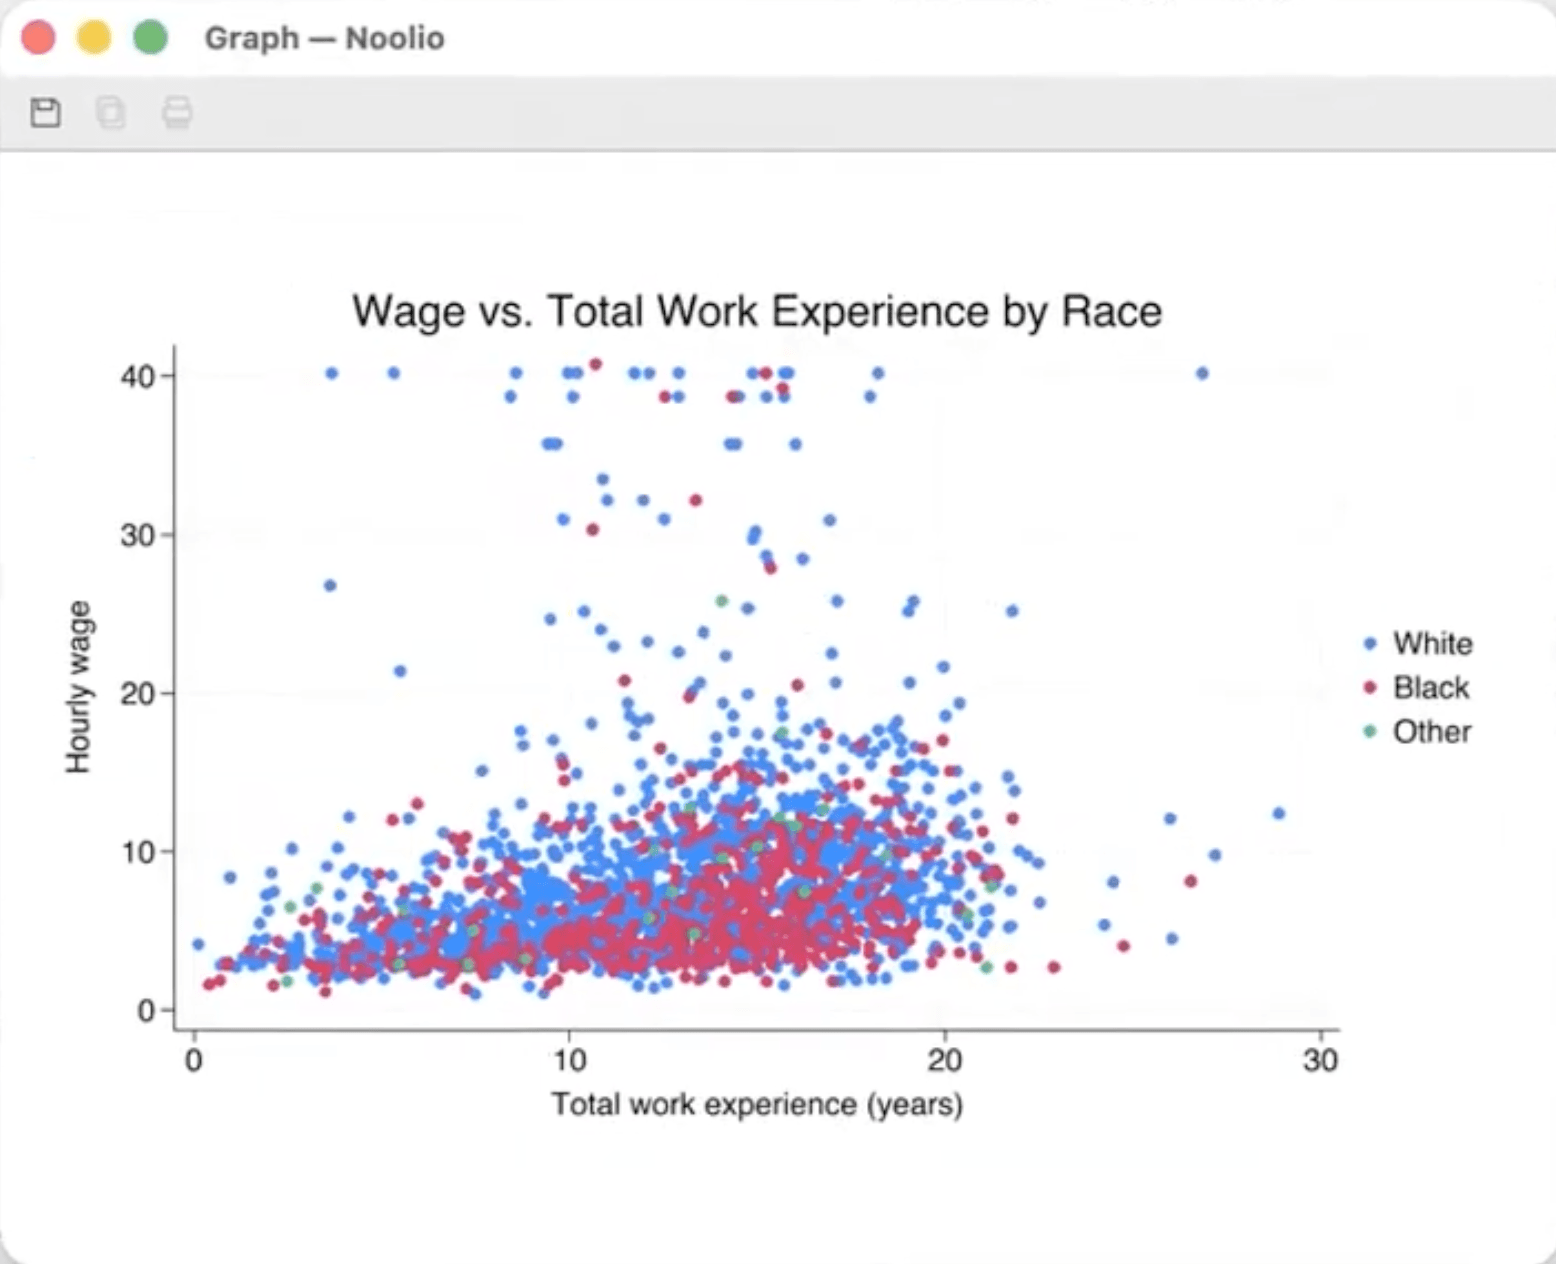
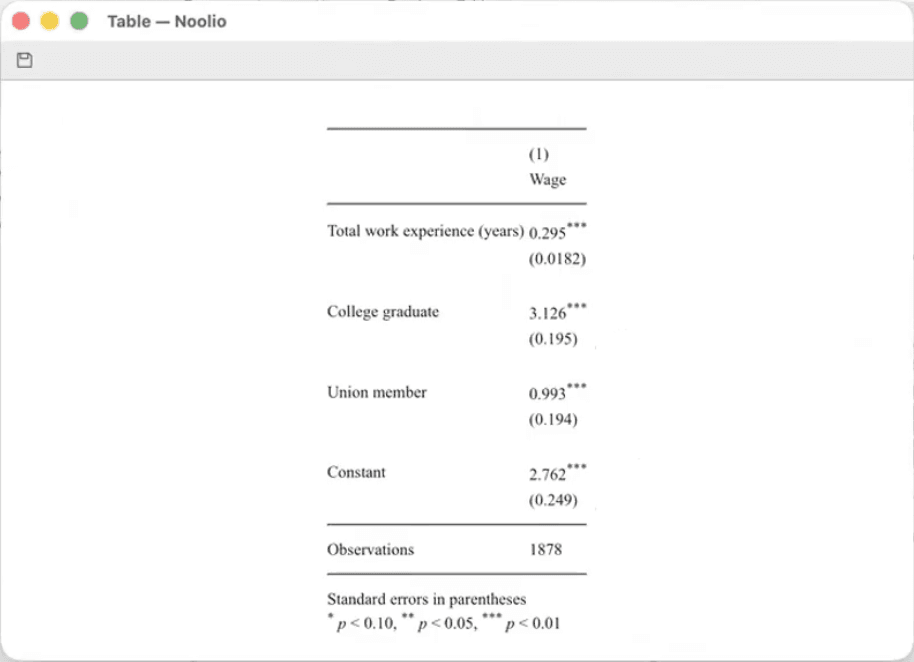
An agent that runs your analysis, not a chatbot that suggests code.
What you do now
- Run the command
- Read the error
- Fix a variable name
- Run it again
- Check the output
- Notice the labels overlap
- Adjust, rerun
What you do with Noolio
- Type the request
- Use the output
› regress wage educ exper tenure, robust
variable educ not found
rewriting command...
› regress wage education experience tenure, vce(robust)
✓ 2,246 observations
The half hour you'd spend on syntax goes back into the analysis.
What you need.
- Stata 17 or newer, installed and licensed on your machine.
- python3. Most Macs already have it. If Noolio asks for it on first launch, download it free from python.org.
- First launch: right-click the app, select Open. macOS blocks unsigned apps by default. You only do this once.
Frequently asked questions.
No, but you need Stata installed.
Got more questions? Write to us at info@noolioapp.com